How to analyse napping by Multiple Factor Analysis (MFA)
What is the Napping method?
Napping is a holistic sensory method to get the sensory distances between products.
Panelists have to arrange all the products on a blank paper sheet according to their own
criteria. The closer products are, the more alike the panelist perceives them. You can also
ask for panelists to write some words which describe the products.
The method is really easy to organize and quick. Moreover, you can directly know which are the
criteria used by the panelists to differentiate the products if they describe the product
positions on their "maps". However, this method is only possible for a few products, and
limited by the size of the blank paper (commonly 60 x 40cm).
Presentation of the data and objectives
The sensory experiment was run on eight cookies tasted by 18 panelists during one session.
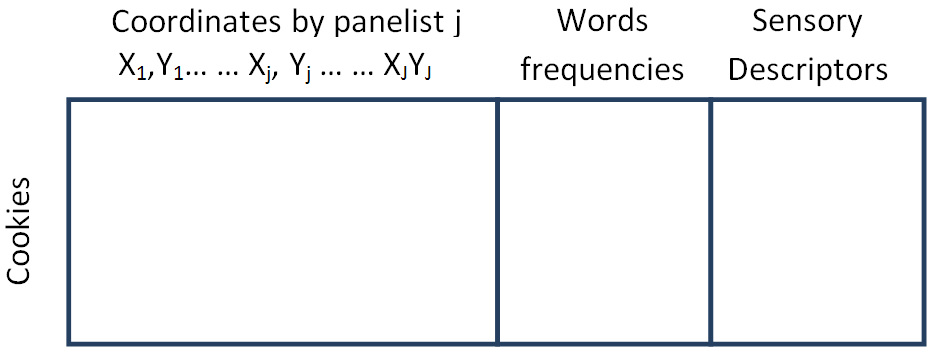
For each panelist j, we get back the coordinates Xij and Yij
of each product i in a table. The next columns are filled with frequencies of the words used by the panelists to
describe the cookies. Then, the last ones are sensory descriptors collected during another session.
For each cookie, the value is the mark mean for all the panelists.
We want to know how judges discriminate cookies and what are their discrimination criteria. We will get a mean
configuration for the panel and the principal components of variability.
Another goal of this study is to characterize the cookies and to look for a typology of the cookies.
Analysis
First of all, we analyze the way panelists arrange all the products. Due to the data structure, we perform a MFA with coordinates (XjYj) for each panelist as groups. In this way, all the judges have the same weight in the analysis. The data of each group aren't scaled because we need the distances between products.
			res.mfa<-MFA (data[,c(2:37)], group=c(rep(2,18)), type = c(rep("c",18)),
			ind.sup = NULL, ncp = 36, axes = c(1,2))

			#data : the napping coordinates

			#group : the different groups of the MFA

			#type : the type of the variables in each group, "c" for centered (unscaled) continuous variables
			res.boot<-boot(biscuits[,c(1:36)], method = "napping", axes = 1:2, ncp=3,
			scale = FALSE, group = c(rep(2,18)),nbsim = 200,level.conf = 0.95)

			#biscuits: the data set used

			#ncp: number of dimensions kept for the bootstrap

			#nbsim number of simulations
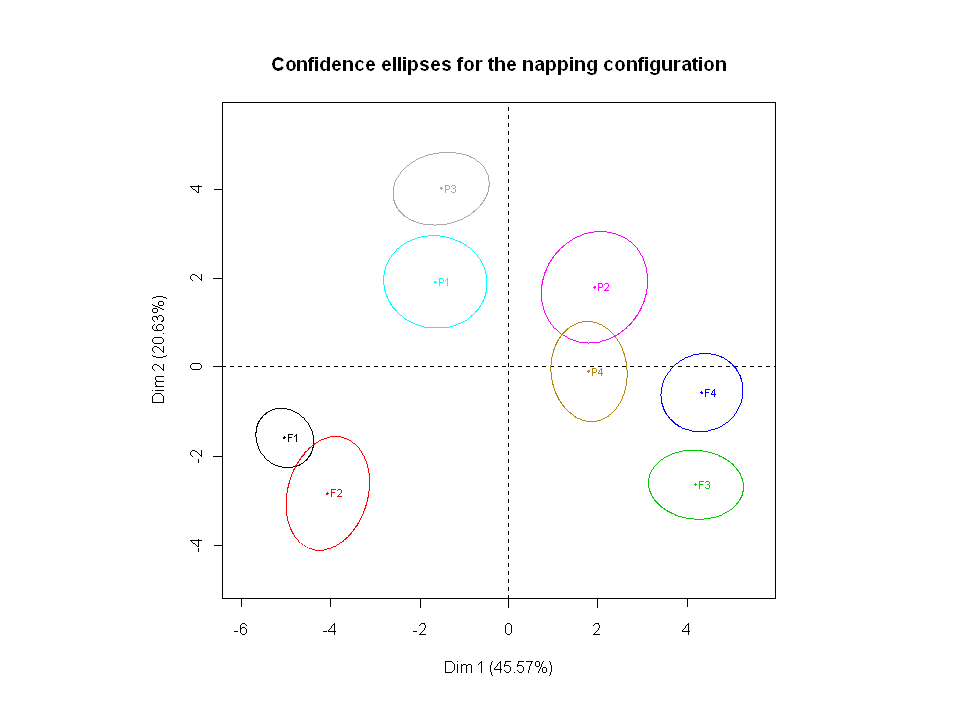
These first results can be interpreted the same way as the ones of a Principal Composant Analysis (PCA). We just add confidence ellipses
around each product dot. These ellipses are built with the total boostrap method. The program simulates virtual
panels. It runs the whole analysis on them and represents them on the true configuration obtained from the true panel.
The ellipses circle 95% of the dots of the same product. So, the ellipses represent the variability of the product position
on the map.
This individual factor map is the mean individual factor map for all the judges. According to the panel, cookies F1,
F2 are opposed to the cookies F3, F4 in the first axis. Moreover, the second axis opposes almost all the « P »
cookies to the « F » cookies.
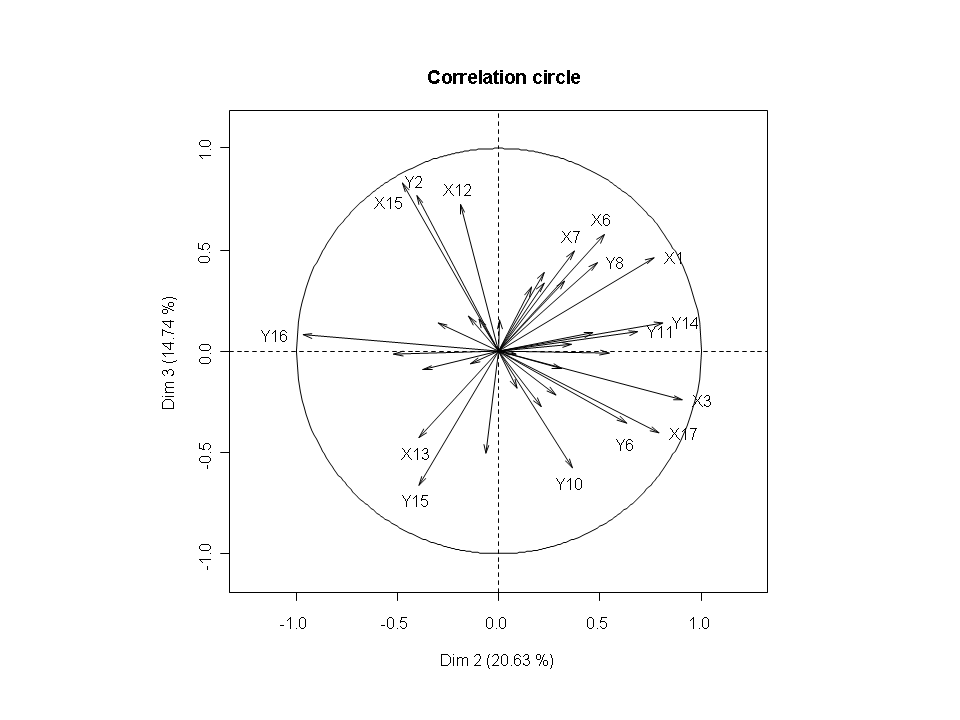
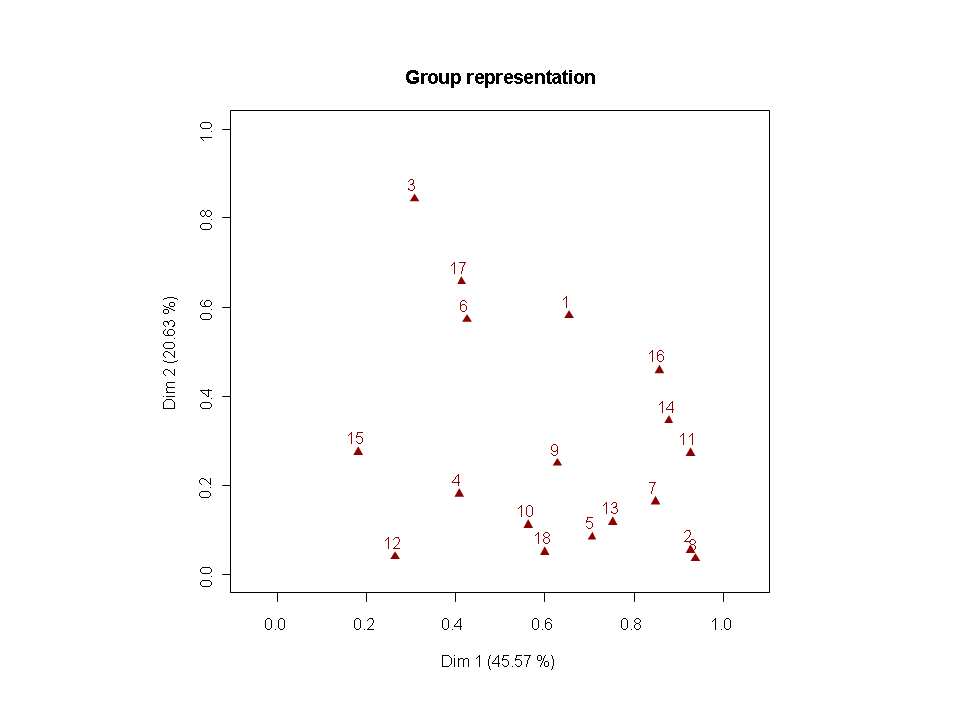
According to the correlation circle, the panelist 16 made a configuration close to the mean individual factor map.
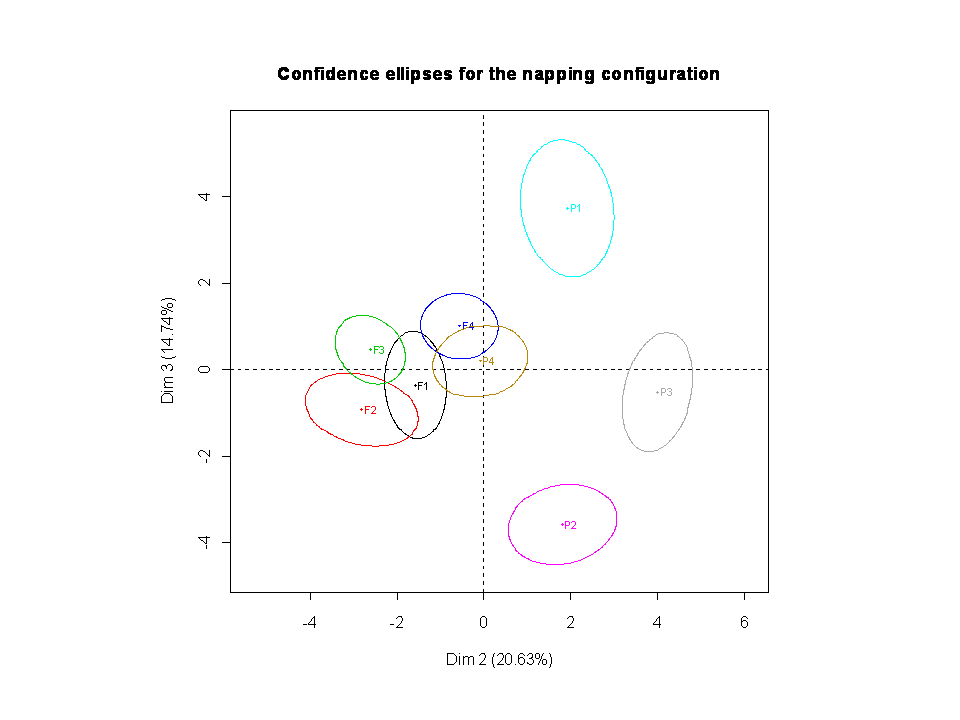
The second and third axis inertia suggest we consider the second plane.
In this second factorial map, there are 4 groups of products. P1, P3 and P2 are well differentiated
and the others are gathered around the product F1.
The correlation circle shows that only some dimensions of panelists' configurations are well represented in this plane.
The group representation shows the representation quality of each panelist. Judges 2 and 8 are well
represented on the first axis. They differentiate cookies as this axis does. As expected, only few judges are
well represented in the second plane. Panelist 15 differentiates cookies as axis 3.
Supplementary variables : descriptors assessment
The most common way to describe these maps is to use variables describing the product features assessed by a consumer panel. These variables are descriptors such as vanilla aroma, crispy, sweet.
			res.mfa<-MFA (data[,c(2:60)], group=c(rep(2,18),23), type = c(rep("c",18),"s"),
			ncp = 36, name.group = c(c(1:18),"desc"), num.group.sup = 19, axes = c(1,2))

			#type : "s" for centered and scaled continuous variables
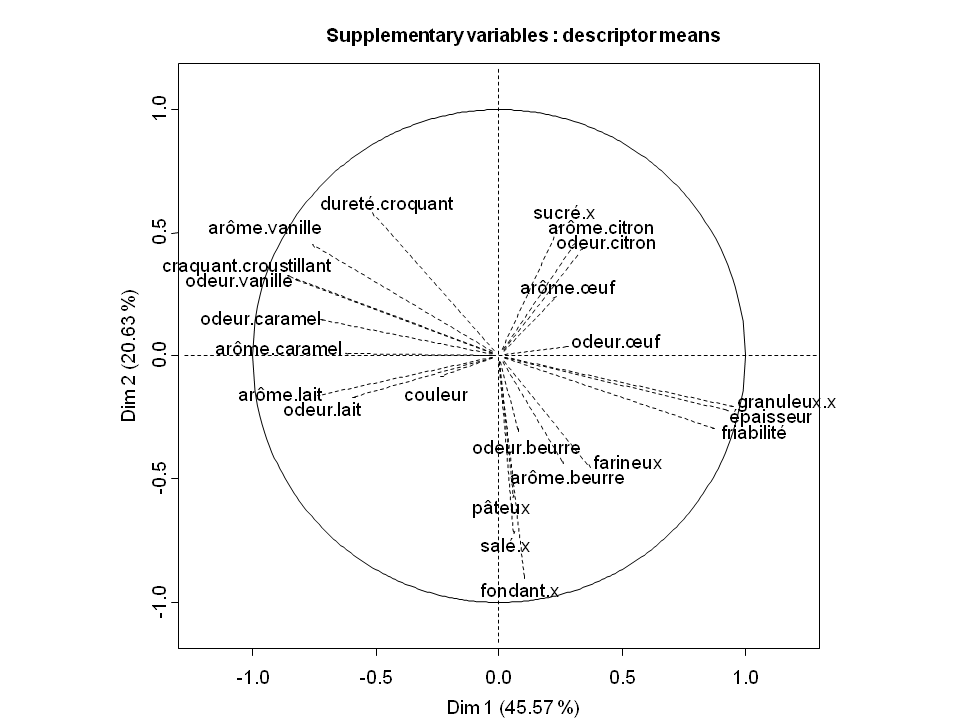
According to the correlation circle, the first component of the MFA is negatively correlated with
the aromas or smells of sugar, vanilla, caramel and milk. These variables express the mildness
feature of the products. But the first component is also linked positively to the granular, the "crumbly"
and the thickness which characterise the crunchy and crispy features of the product. The "crunchy"
and the mildness are negatively correlated.
The second component increase as sugar and as aroma and smell of citrus. It is negatively correlated
with salt and "melting".
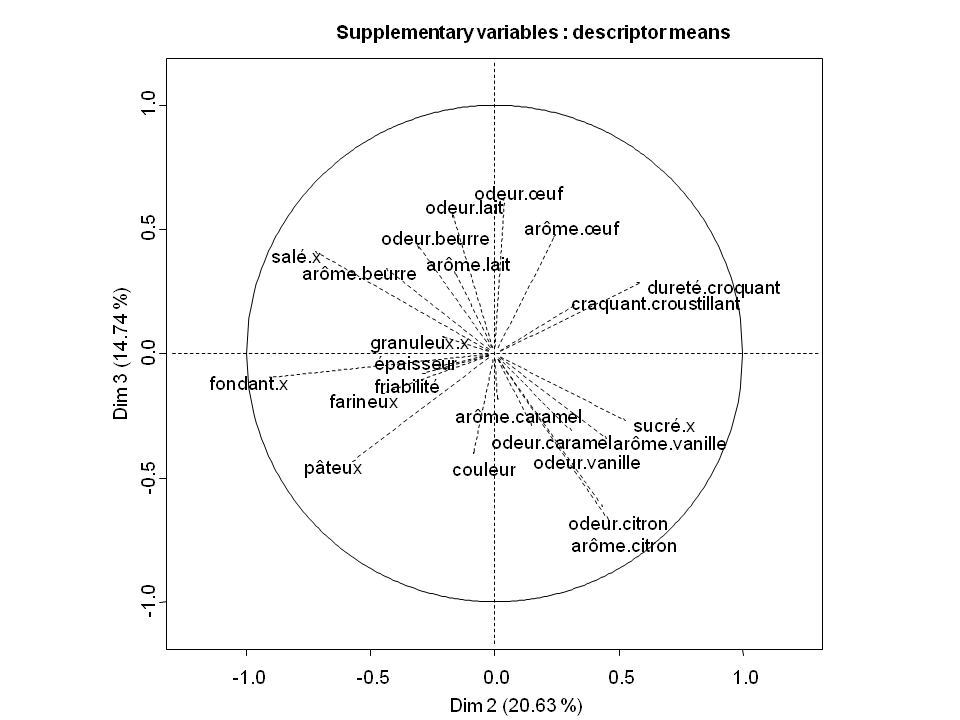
The third axe separates the perception of the basic ingredients as butter, milk or eggs and the most
unexpected or complex ingredients as aroma of citrus and vanilla.
Supplementary data : words frequencies
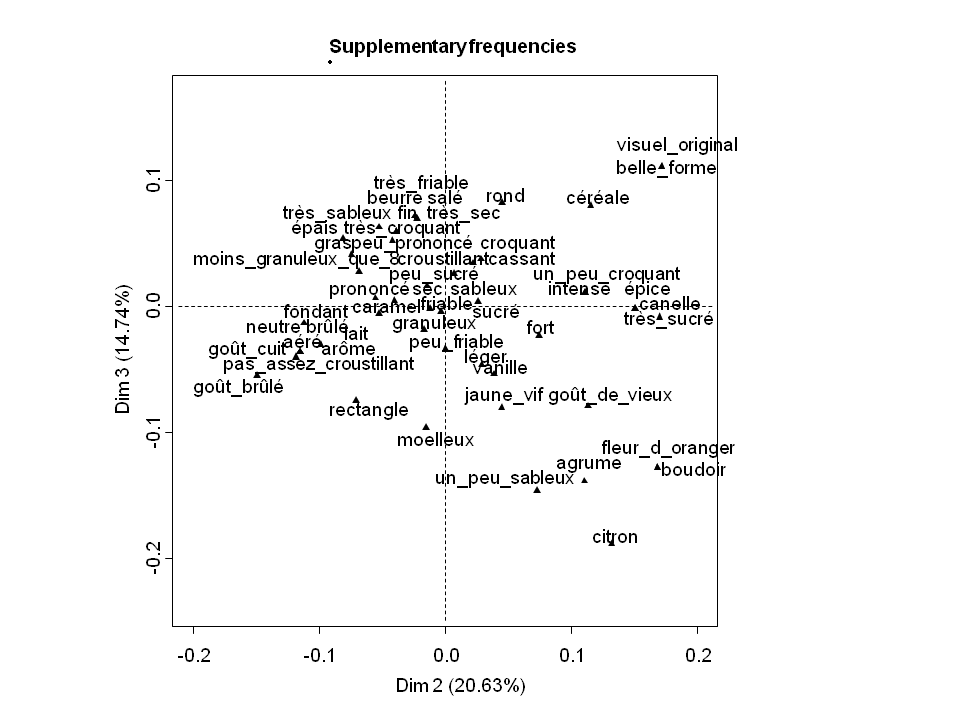
Adding supplementary variables as words used to describe the personal napping of each judge allows us to understand the meaning of the axes. Because of the word amount, we only keep the words counting more than once. A common mistake is to use each word as a variable. However the contingency table product x word is filled with frequencies, ie at the intersection of a row and a column is the frequency of use of a word for the product description, columns and rows have a symmetric role. A word has a profile of products, and a product has a profile of words used to describe them. In order to consider this structure, the words are projected at the product barycenters, on the factorial map.
			res.mfa<-MFA (BiscMots[,c(2:91)], group=c(rep(2,18),54), type = c(rep("c",18),"f"),
			ncp = 36, name.group = c(c(1:18),"mots"), num.group.sup = (19),axes = c(1,2))

			#type : "f" for frequencies
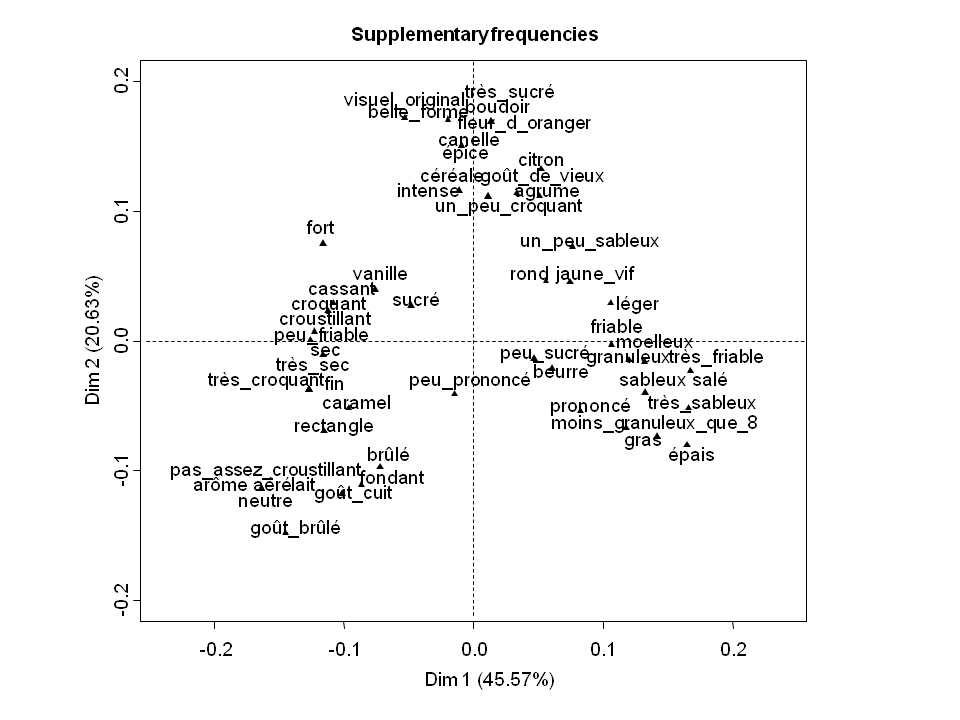
Because of the nature of the projected objects and the intensity of results, the words are quiet
concentrated in the middle of the map, that is why we have to focus and zoom at the origin.
The first component opposes words describing crispy and sweet products, and smelling vanilla
to other words describing a product with a stronger butter taste and a feature particularly sandy.
The second component seems to differentiate a more personal or subjective product descriptions.
Indeed, at the top of the map, the used words are dealing with the taste nuances, mentioning the citrus or
orange blossom aroma whereas we can find expressions of burnt taste, or fat at the opposite .
The third component is not really linked to a meaningful word projection. Maybe we could
consider the texture as a lexical field link to this component. Indeed, from the bottom to the top
we can discern the words "un peu sableux", "sableux", "très sableux" relating to the sandy texture of
the products.
Conclusion
Based on the analysis of the product map and the supplementary variables, we get characteristics of the cookies and the way judges differentiate them.
- F1 : mild, salty, melt in the mouth, crispy, burnt taste
- F2 : mild, salty, melt in the mouth, crispy, burnt taste
- F3 : crunchy, saltier and metls more in the mouth than F4, buttery, sandy
- F4 : crunchy, buttery, sandy
- P1 : sweet, mild, basic ingredients, sophisticated
- P2 : sweet, complex ingredients, sophisticated
- P3 : sweet, mild, buttery, sophisticated
- P4 : sweet, mild, buttery
The descriptors projection allows us to understand the napping configuration.
This information is accurate. It is possible to visualise the correlation
between the components and the product caracteristics sensed by the panelists. But we can only
learn about the feature we asked for.
The words frequencies projection is more ambiguous and matchs to an explanatory approach.
This step allows us to underligne the main feelings of the consummers about the produts. However,
these results are less accurate, subjective and hedonic sometimes.
Alternative methods
- We can also create as many groups as panelists. For each judge, we have both the coordinates of the cookies and the words this judge to characterize cookies.
- We may want to know how judges discriminate cookies based on both the coordinates of the products on the sheet and the words that judges use to characterize them. In this order, we perform a Hierarchical multiple Factor Analysis with two groups: coordinates and words. And inside of the coordinate group, we use the coordinates (Xi,Yi) for each panelist as groups.
