GRAPHINTER: GRAPHical display of the INTERaction between two qualitative variables
Description
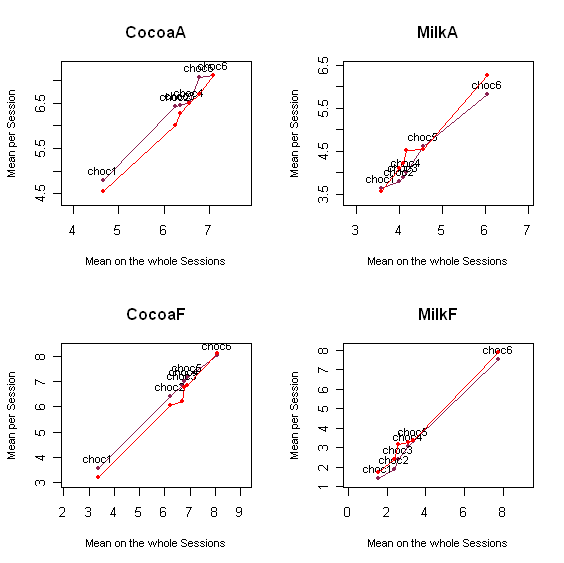
This function is designed to display the interaction between two qualitative variables, in most cases the product and the session variables. The data set must be balanced (or not too much unbalanced).
| Results | |||||
|
graphinter |
|||||
|
|
|||||
Outputs
A list containing the following elements:
prod |
a data frame of dimension (p,q), the means over the panelists and the sessions for the p products and the q sensory descriptors |
seance |
as many matrices of dimension (p,q) as there are sessions, the means over the panelists for the p products, the q sensory descriptors and for each session |